
Chris Sloane

I run marketing services, and I build the systems that make them work.

Fifteen years running agencies and digital teams. The software came out of the work itself: forecasting an owner reads on Monday, reporting that builds itself, campaign tooling, and AI that handles the repetitive parts so people keep their time for judgment and clients.

Chris Sloane
operating map
15+
Years operating
agencies and digital teams
30+
Systems
built and in use
3.77%
Forecast MAPE
anonymized B2B model
Work becomes pattern. Pattern becomes software.
30+
production systems
170+
agency clients
165+
ad accounts modeled
3.77%
forecasting MAPE
Work becomes system

Real businesses make the work. The software comes out of it.

This is the connective tissue: real businesses produce the work, repeated work becomes software, and only public-safe proof makes it onto the page.

Trace the systems
01 / agency work

The businesses create the messy work.

The agencies are where the work is real. Calls, campaigns, reports, hiring, billing, and follow-up create the constraints worth solving.

Open companies
live-site proof
Paving Marketers homepage screenshot
170+
agency clients
165+
ad accounts modeled
02 / repeated pattern

The repeated parts become a map.

A workflow only earns software after it has annoyed me more than once. The pattern gets named, numbered, and routed.

Read field notes
operator log
> // bottleneck: report assembly
> source -> rank -> review -> sales note
> manual minutes removed: 60-120
> next: make the report useful while warm
5
route stages
1
repeatable loop
03 / shipped tool

The map turns into software.

The public systems are not demos. Each one got built because a live business needed it, then kept using it.

Inspect systems
system surface
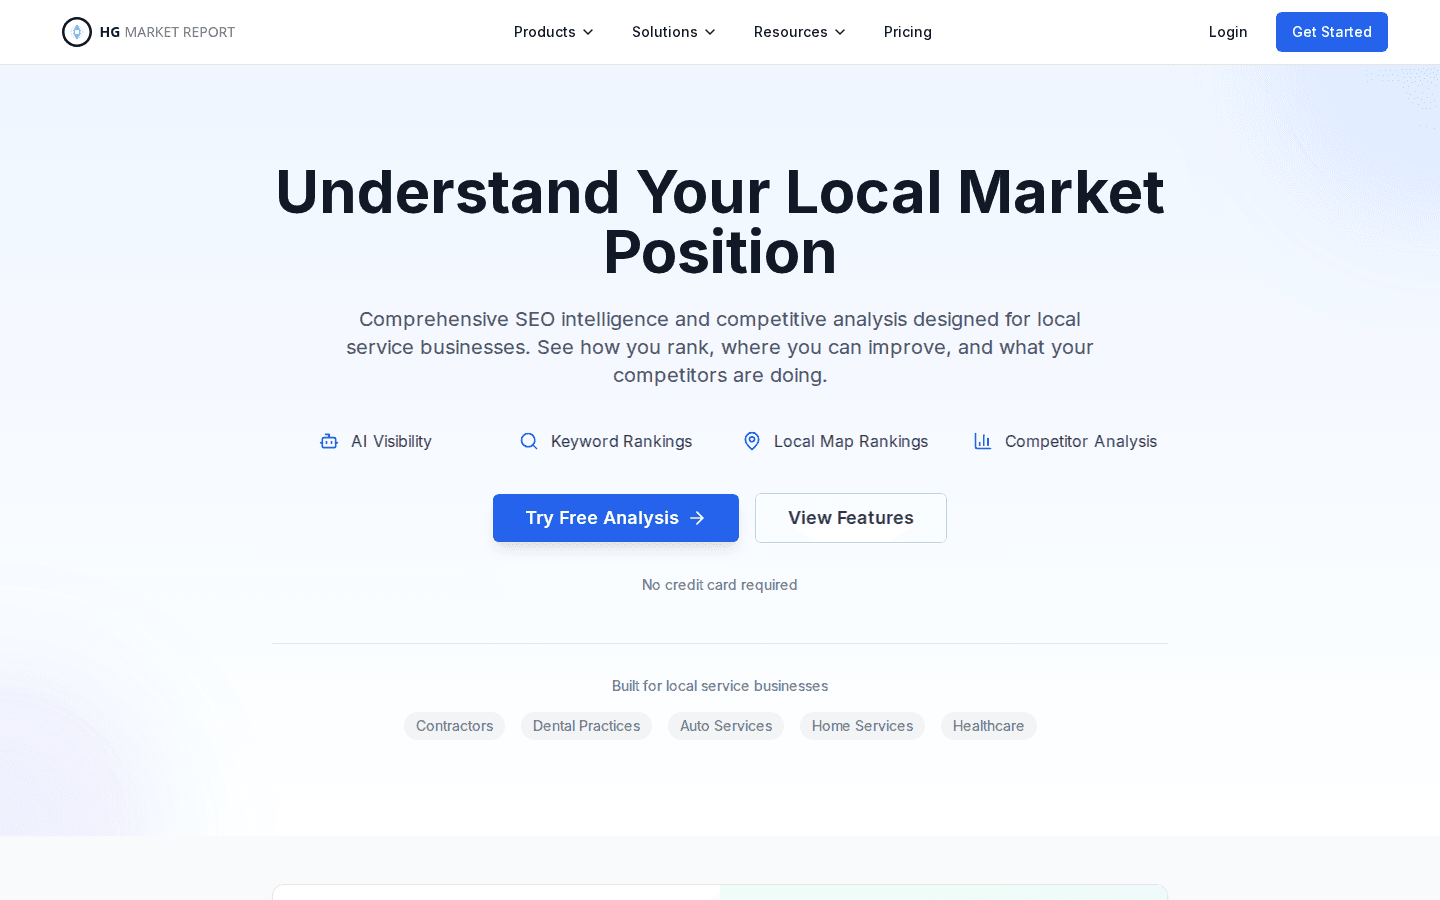
HG Market Report homepage screenshot
30+
production systems
1-2h
report work replaced
04 / the proof

The numbers point back to the work.

Public-safe results only. Private client records stay private; what I can show, I show with the caveats that belong on it.

See the ML work
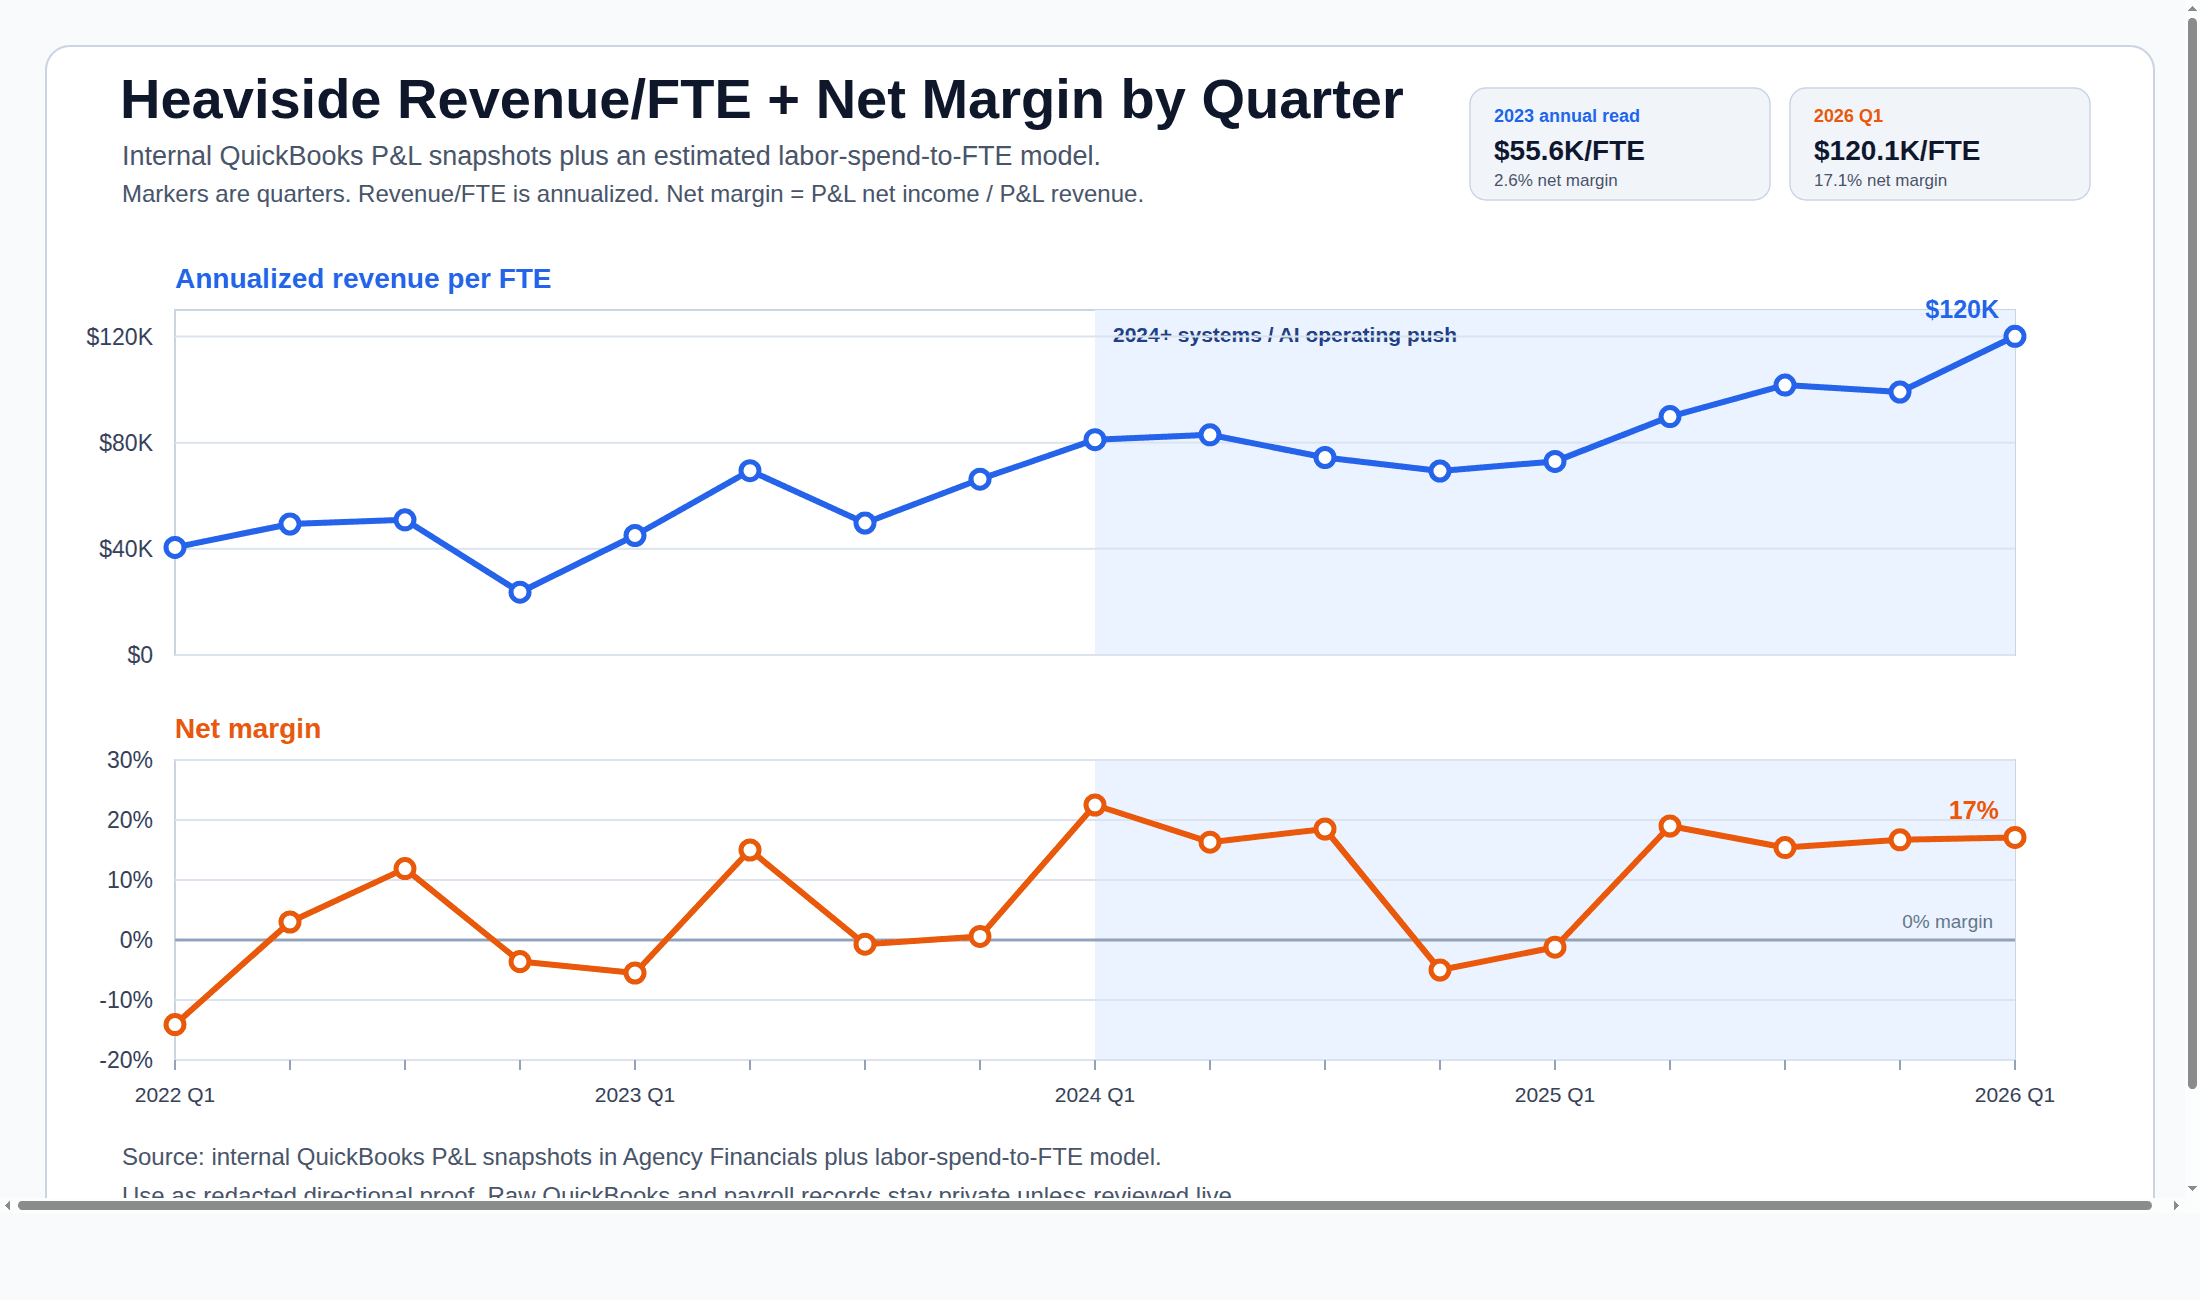
operating economics
Revenue per FTE and net margin by quarter
~2×
revenue per FTE
3.77%
forecasting MAPE
The numbers

A few numbers I can share.

Public-safe and rounded where it has to be. The rest stays out of public view because it isn't mine to share.

30+

Production systems

Software I ship and use, not a demo wall

170+

Agency clients

Across Paving Marketers and Garage Door Marketers

165+

Ad accounts modeled

Years of paid-ad data across home-services verticals

2×

Revenue per FTE

Roughly doubled since 2023 as the work moved into systems

3.77%

MAPE (anonymized B2B)

Production revenue forecasting via 369-experiment autoresearch

Pick a thread

A few ways into the work.

Start with the companies for context, the software for the builds, or the machine-learning work if you want the technical depth. Every claim here is one I can back.

One example

A sales deck became a working report.

HG Market Report pulls a market's rankings, ads, and reviews into a report an owner can read. It replaced manual data pulls and deck assembly with something the sales team can use while the conversation is still warm.

Public claim
1-2 hours

Estimated report-assembly time replaced per market report.

What it buys

A buyer gets useful signal without waiting on a deck. The team spends its time on fit, judgment, and follow-up.

See HG Market Report